- Welcome to #1 Roulette Forum & Message Board | www.RouletteForum.cc.

Friendly & Productive Roulette Forum.
Popular pages:

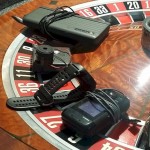


visual ballistics
Started by RouletteGhost, Sep 09, 06:59 PM 2016
Previous topic - Next topic0 Members and 2 Guests are viewing this topic.
User actions